BAE SYSTEMS
Helping Data Analysts Gather Insights with AI
BACKGROUND
By the beginning of 2024, BAE Systems had completed a few prototypes of data analysis tools that continuously got reworked due to usability. The process was very technical and users felt the prototypes clunky and tedious, leading to abandonment and frustration. As a new phase of the project got approved, I got brought in as a UX Designer and later became Assistant UX Design Lead, to join a 3-person UX team to do a full re-design of the product while incorporating AI.
Quick Disclaimer: Because the details of this product are confidential, this case study will primarily focus on the process with a sample product that I designed that does not show real data.
MY ROLE
As an Assistant UX Design Lead, my goal was to simplify the workflow, making it easier for users to understand the tool and allow them to draw conclusions for their analyses quickly. Additionally, for my team, I had a goal of ensuring we covered the "must-have" use cases and designed effectively. My role included a mix of UX, research, copywriting and visual design.
I contributed to a cross-functional team of about 30 professionals, collaborating with product managers, software engineers, researchers, and system engineers
Project Type
Responsive Website
Role
Assistant UX Design Lead (Syp Siligato,
UX Design Lead; Hannah Choi, UX Designer; Eugenia Tzeng, UX Designer)
Methods
User Research
Wireframing
Usability Testing
Design Systems
Tools
Adobe XD
Adobe Illustrator
Confluence/Jira
Microsoft Suite
Duration
Feb 2024-Present
PROBLEM
USERS LACK A CENTRALIZED WAY TO ANALYZE DATA QUICKLY
Upon taking on this project, my team analyzed research, existing systems, and prior protytpes and noted these key problems:
-
Analysts struggled to quickly find and interpret relevant insights within large, complex datasets.
-
Users faced a lack of a centralized place to analyze data — information was scattered across multiple systems.
-
Users needed to cross-reference multiple data sources, but workflows were slow and cumbersome.
-
Users needed highly secure access controls without creating friction in daily work.
-
Collaboration between teams on insights and analysis was inefficient or fragmented.
-
Existing tools and prior prototypes were outdated and didn’t match the efficiency and usability of modern technology

THE SOLUTION
HOW MIGHT WE ALLOW USERS TO ANALYZE DATA QUICKLY AND EASILY

1
Centralized workspace that unifies scattered data and provides real-time AI insights
We created a unified environment where analysts can access and analyze all relevant data in one place, making insights easy to identify and eliminating the need to analyze data across multiple locations.
This is an example for illustrative purposes and does not represent any actual data.
2
Enhanced Collaboration
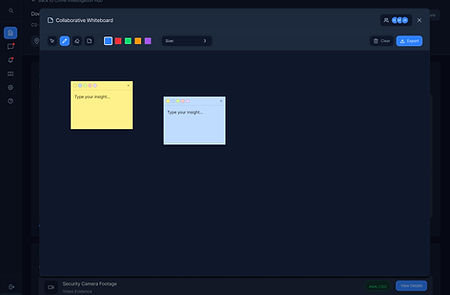
Previously, users were limited to external chats and manual methods for sharing insights. The new experience introduces real-time co-creation within a whiteboard, along with the ability to export and share work directly from the system, streamlining communication and improving team efficiency.


This is an example for illustrative purposes and does not represent any actual data.


3
Cohesive & Modern UI
I led the creation of a cohesive design system, following Material Design principles and leveraging FontAwesome icons, to deliver a modern, engaging UI that makes complex data approachable, intuitive, and visually engaging.
APPROACH
UX APPROACH: 12 WEEK SPRINT WITH 3 WEEK ITERATIONS
This project operated in 12-week design sprints, each consisting of four 3-week iterations. In each sprint, the UX team focused on designing 2–3 features that would be implemented in the following sprint. We followed a cyclical approach that included planning, collaborating with research on user needs, designing concepts, validating feasibility, and refining designs to a final version.
Our process was fluid, and as we designed and failed fast, we iterated on our workflow and aligned with architecture and engineering leads with the final process below.


When features lacked clarity or sufficient research, we ran a Google Design Sprint a five-day process (Understand, Define, Sketch, Decide, Prototype, Validate) that rapidly aligns teams, tests risky ideas, and compresses months of work into a single week. Our customized approach worked better in a six day sprint which included:


UNDERSTANDING THE USER
COMMUNICATING REGULARLY WITH RESEARCH AND CONDUCTING REMOTE USER TESTING PROVIDED USER INSIGHTS
Our research process involved 3 primary methods: 1) daily connections with the research team, 2) concept testing with users, or 3) participatory design sessions with users. It’s important to note that these are not an either/or type of research method amongst the three but are performed in conjunction with each other. Although we had the personas and user journey maps prior from prior research (not shown due to sensitivity), we conducted research continuously.
From the various meetings with the research team and from our Google Design Sprint we learned a few major insights:

Users want a centralized space to perform tasks and view the data they care about

Users want an automated way to get notified of patterns and trends as well as new evidence.

Users want to perform their end-to-end analysis and share insights in a collaborative environment.
WIREFRAMES
THE PROCESS OF CREATING WIREFRAMES
In each 12- week sprint, the UX team focused on designing 2–3 features that would be implemented in the following sprint. During each quarter sprint, each UX designer led features to bring to low-fidelity by the end of the 12-week period. This consisted of competitive audits,sketching, then bringing the design to low fidelity, iterating. The flow can go back to other steps where needed and is not linear.

This design flow is similar to what I’ve done in other projects like Northeastern CAMD. After this lo-fidelity design is complete, we discuss feasibility with developers and begin the high-fidelity wireframes and refine.

FINAL DESIGN
FINAL FLOW
This is the final flow that I designed to showcase data analysis with a crime investigation product. This is not representative of actual data and is only an example.

VISUAL DESIGN
BUILDING AND MANAGING THE DESIGN SYSTEM FROM THE GROUND UP
A key part of my role was leading the creation of our design system. Because this was an entirely new product with no existing design foundations, I researched best practices and developed a strategy to integrate design system development into our ongoing workflow. In collaboration with developers, we aligned on using Vuetify, an open-source library based on Google’s Material Design, as the foundation for our components, and FontAwesome for icons.
Our process was structured in two phases: initial design (exploring and defining components) and final spec(documenting in Confluence and Adobe XD and delivering production-ready designs). The below became the acceptance criteria for Jira tasking.
Phase 1: Initial Design
-
Research Vuetify Standards and analogs where relevant, depending on if the component can follow Vuetify/Material standards or if it’s a custom component
-
Compile feasibility questions to bring to developer review
-
Create and refine low-fidelity design
-
Obtain feasibility signoff from the developers
Phase 2: Final Spec
-
Document redline annotations for components with a table of specs in the internal wiki page
-
Add the final component to the master design file for team to easily grab and use
To arrive at the foundational areas, the colors and typography, we went through mood board exercises with the customer to identify the look and feel of what they wanted for their system and arrived at the color palette below from Material Design’s theme builder:

Once the foundational elements were established, we then began designing components. Here’s an example of a snackbar I worked on:

Due to information sensitivity the full design system and Confluence wiki documentation cannot be presented. The final set of components included a variety of standard components such as buttons, cards, data tables, chips, menus, tooltips, text fields, as well as a set of custom components for cards, card containers, and others more specific to the system.
CHALLENGES
DESIGN CHALLENGES: NAVIGATION AMBIGUITY, SPEED, AND CROSS-TEAM ALIGNMENT
Challenge 1: Balancing Speed, Collaboration, and Feasibility
As a new product with a newly formed UX team, we had to ramp up quickly while working across teams with different priorities. UX focused on usability, engineering prioritized feasibility and delivery. Aligning required fast iteration, close collaboration, and flexible problem-solving.
Challenge 2: Iterating the Design Process Midstream
Early on, system engineers drove the design approach, bringing UX in late. This limited our ability to advocate for user needs. We evolved the workflow to involve UX from the start—research, design, then feasibility checks—closing gaps and improving both usability and delivery speed.
Challenge 3: Shifting from Lo-Fi to High-Fi Under Constraints
Shifting customer priorities reduced time for hi-fi designs and design system integration. We prioritized essential components, focused on clarity and usability, and phased in visual refinements over time to maintain momentum without sacrificing quality.
IMPACT
HIGHER SATISFACTION RATES AND USABILITY TESTING PARTICIPATION
Since the beginning of our user testing, we presented concepts to remote users and asked them to provide us measures with a System Usability Scale. Over time as we continue to test and update the product we've seen:
20% increase in satisfaction ratings
Over 50% increase in our usability testing participation due to excitement for using the product
30% estimated reduction in time to insight rate
NEXT STEPS FOR BAE SYSTEMS
Moving forward, our focus will be to continue refining the experience. We will do that through iterative design and user testing. This will allow us to validate features with real users, ensuring every design is grounded in their needs and workflows. By maintaining a user-centered mindset throughout development, we'll continue shaping solutions that are intuitive and impactful, supporting our users in translating complex data into clear, actionable insights.
CASE STUDIES LIKE THIS
NORTHEASTERN UNIVERSITY CAMD
BIG COJONES GOLF


